Very often we need to measure how long a device or some process is up, time function not a column in InfluxDB and can’t be counted.
SELECT COUNT(time) FROM measurement WHERE...
This function does not work in InfluxDB see issues on Github.
Right, but there are some possible solutions.
Get uptime via client
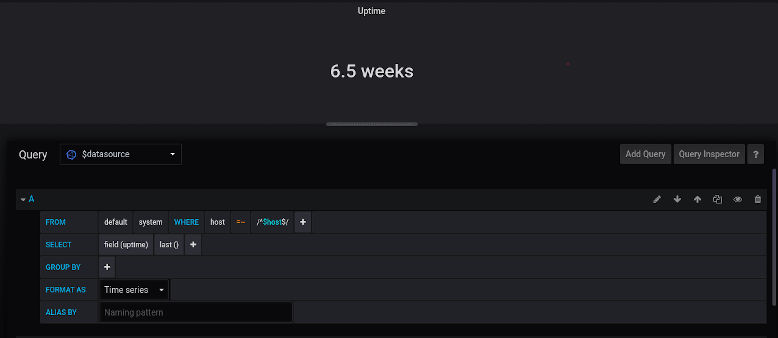
When you design InfluxDB client, or use telegraf client, always when is possible get up time.Most devices today have integrated uptime function and you only need to get value. If your device or application has API it pretty easy, add telegraf json plugin input. Example:
[[inputs.httpjson]]

  name = "router_stats"

  ## URL of each server in the service's cluster
  servers = [
    "http://localhost:8000/api"
  ]
  ## Set response_timeout (default 5 seconds)
  response_timeout = "5s"

  ## HTTP method to use: GET or POST (case-sensitive)
  method = "GET"
  ## Tags to extract from top-level of JSON server response.
   tag_keys = [
     "routerID"
   ]

Get uptime via sensors
When you working with Industrial IoT (IIoT) and measure data from sensors very offen you don’t have uptime for industrial devices, but information about uptime can be of great weitness. There are solutions using electronics to see if the device consumes electricity, but they can be complicated.
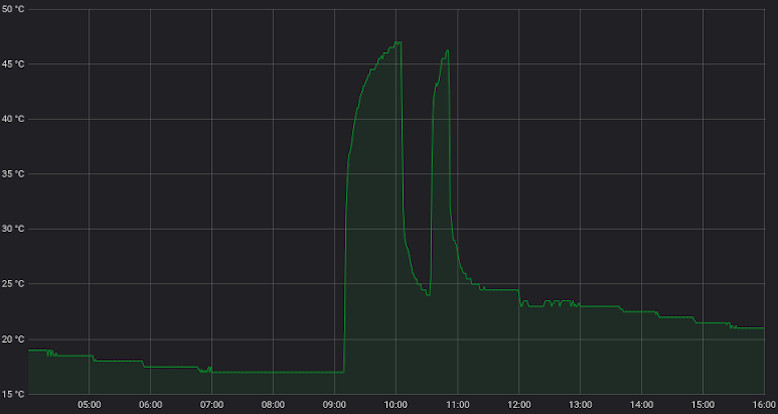
Fortunately, there are solutions using physics and mathematics that can be used easily. Let’s break it down, if you’re working IIoT you’re probably reading some values from a sensor, like temperature, pressure, force, signal lamp etc. In addition to the basic data you read from the sensor, this data also carries additional information. What information? Example, if you have a heater, you can know via temperature sensors does heater working. If temperature > 30°C heater working. Also, if any, physical value changes during operation, it is easy to add a sensor. You can see function f(T,t).
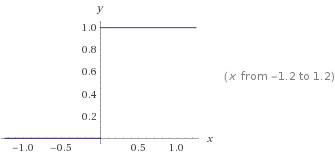
 Now we know when heater working, but how to calculate time? It’s easy with little mathematics. We need a crate, step function from this value, or convert temperature function to new function f(T,t) = 1 if T>30°C and f(T,t) = 0 if T<30°C. When a device on value is 1, when off 0.
If we derived number with self we always get 1. x/x=1, but if derived |x|/x we get the sign function
If we add +1 to sgn(x) we will get step funciton, 0, 2, but we need 1 [sgn(x)+1]/2.

Now we need convert T>30 and T<30 to 0, 1. Finaly it’s function:
f(t,T)= [|T-30|/(T-30) + 1]/2, where t is time, T temperature.
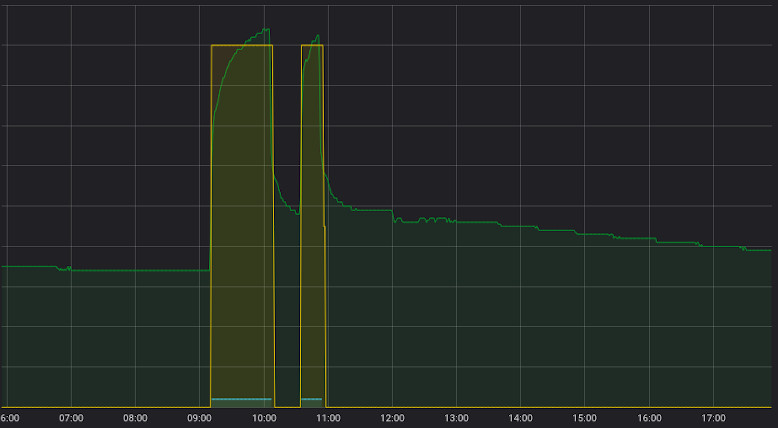
With T-30 we will reduce values < 30°C. Now we need only count the number of 1 by time group in the range, it’s our calculated uptime. If add GROUP BY time(1m) in query sum will be in the minutes. Finally InfluxDB query as graph:
SELECT ((abs(mean("temp_input") - 30 ) / (mean("temp_input") - 30) + 1 ) /2) as uptime FROM "sensors" WHERE ("feature" = 'temp1') AND $timeFilter GROUP BY time(1m) fill(null)
Another solution is to selecet only values > 30 and count number and add to your dashboard example Grafana.
SELECT (mean("temp_input")/mean("temp_input")) as "out"
FROM "sensors"
WHERE ("feature" = 'temp1') AND "temp_input"> 30 AND $timeFilter
GROUP BY time(1m)
